Pull up a home value estimate for Summerville and you'll get a single number. As of August 2026, one widely used site put the town's median sale price at $410,000, down slightly from a year earlier. Drive to Hutchinson Square with that number in your head and you'll wonder who's lying to you. Nothing near Azalea Park sells for anywhere close to $410,000. Then drive twenty minutes out to Nexton or Cane Bay Plantation, where entire subdivisions of new construction close right around that figure, and the number suddenly makes perfect sense again.
That whiplash is the point. Summerville doesn't have a housing market. It has at least two, stapled together under one town name, and the median price you see on any portal is the blended output of both. If you're comparing Summerville to another Charleston-area town using that single number, you're comparing the wrong thing. Here's what's actually inside it.
Four Sources, Four Numbers, Same Month
Pull the same "Summerville median home price" from four different places in the same window and you get four different answers. One source reported $410,000 as the median sale price for August 2026. Another put the average house price at $364,000 for the same recent month. A third listed the typical home value at $373,685 as of the end of July 2026. A fourth showed a median list price of $425,000 with a price per square foot near $199, also for July 2026.
None of these sources is wrong. They're measuring slightly different things (sold price versus list price versus an algorithmic value estimate) over slightly different windows, and each is drawing from a pool of homes that mixes a 700-structure historic core with thousands of new-construction closings spread across master-planned communities. When your sample includes both a 1920s bungalow near Hutchinson Square and a spec home in a subdivision still releasing new phases every year, small differences in methodology produce numbers that look like they're describing different towns. They sort of are.
What's Actually Being Averaged
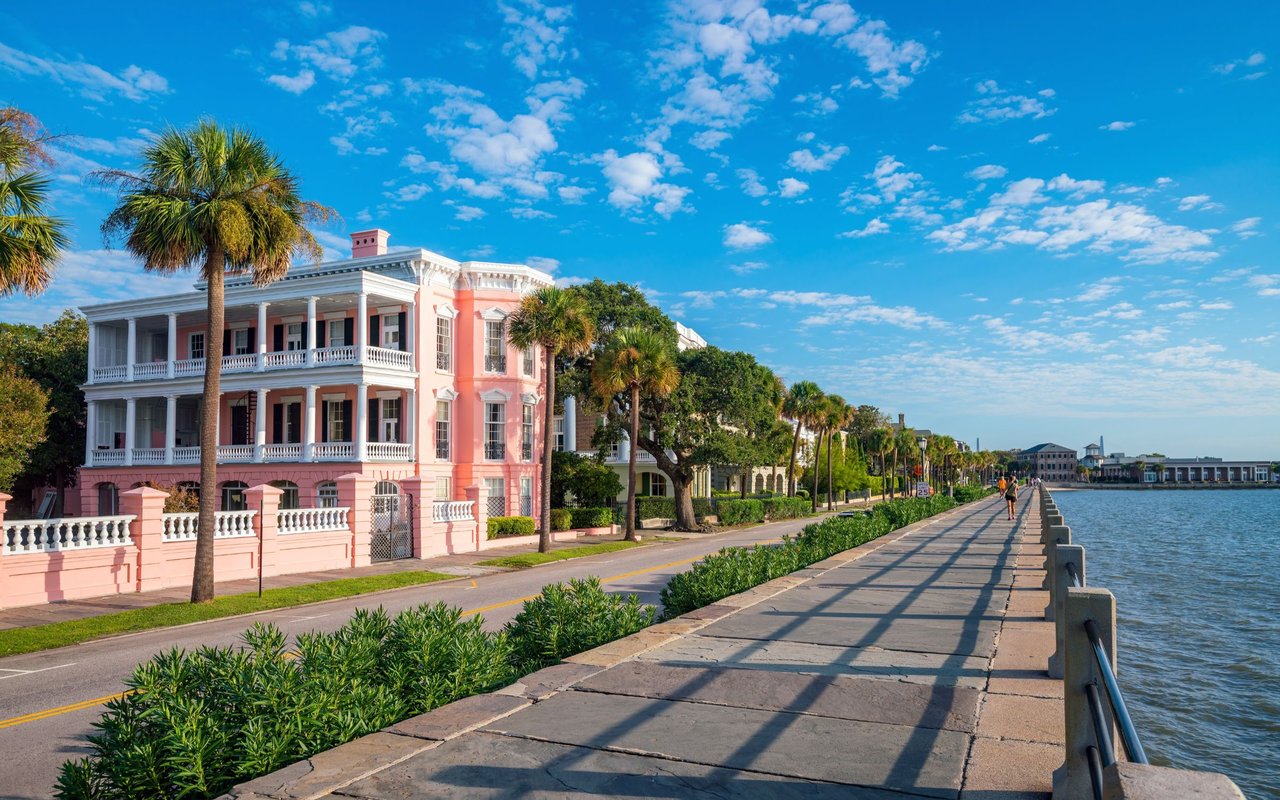
On one side of that average sits the Summerville Historic District, listed on the National Register of Historic Places since May 1976. Roughly 700 structures contribute to that designation, and about 70 percent of them predate World War I. The district wraps around Hutchinson Square and Main Street, with Azalea Park, planted with 33,000 azaleas in the 1930s, anchoring its southern edge. The Summerville Family YMCA has run the Flowertown Festival out of that park since the early 1970s, and the town also markets itself as the birthplace of sweet tea, a nod to the Pinehurst Tea Plantation founded there in 1888.
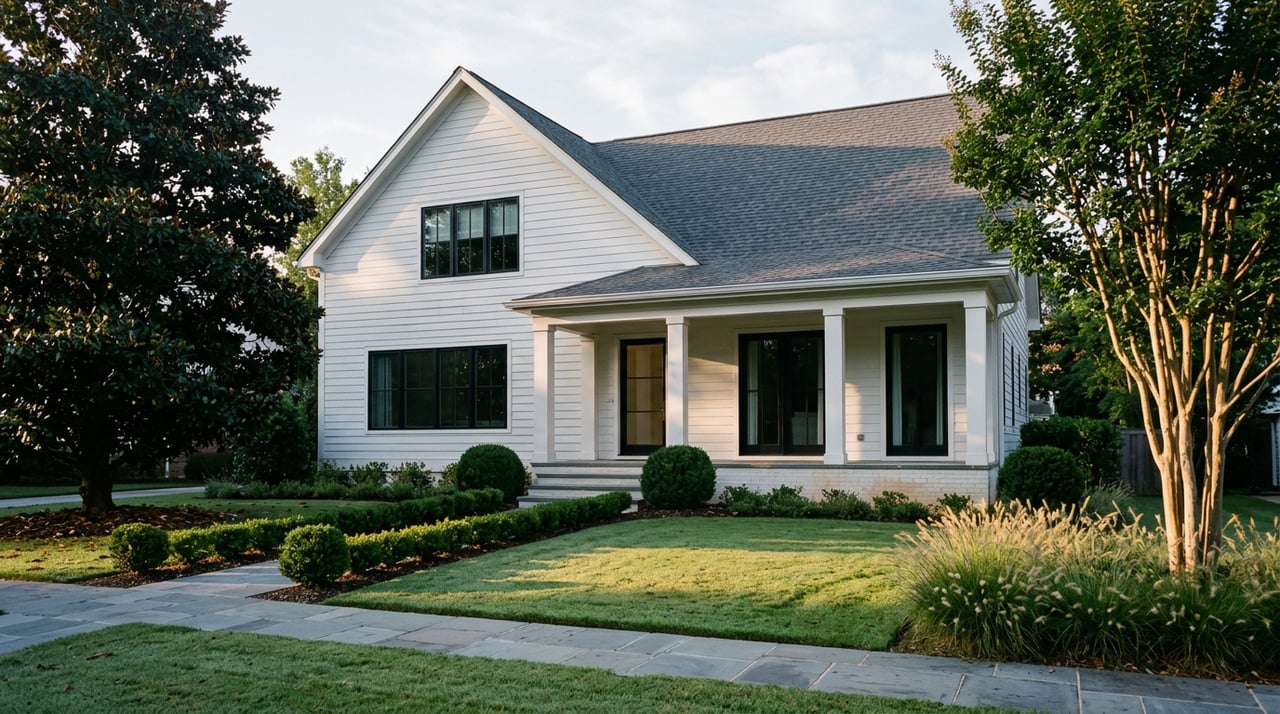
On the other side sit places like Nexton and Cane Bay Plantation, master-planned communities built from the ground up over the past decade or two. Nexton pairs new-construction neighborhoods with its own retail hub at Nexton Square and gigabit fiber internet. Cane Bay Plantation is anchored by a YMCA, a Publix, and a Target, with miles of walking trails threading between its subdivisions.
These aren't two flavors of the same market. They're a low-volume, fixed-supply core competing against a high-volume, still-building supply engine. That difference shows up in the numbers in a way that matters more than the median itself.
A Number That Contradicts Itself in the Same Sentence
Here's where it gets genuinely strange. Look at the Historic District's own listing data, current as of July 2026. In one line, the average house price for the most recent month came in at $870,000, up 29.8 percent from a year earlier. In the next line, the median sale price over the three months ending in May 2026 was $391,000, down 52.9 percent year over year.
Those two numbers aren't describing a market in flux. They're describing a market too small to average reliably. Only 13 homes sold in the Historic District in May 2026, down from 14 the year before. With a pool that thin, one or two high-value estates closing in a given month can swing the average by 30 percent in either direction, and swapping a one-month window for a three-month window changes which handful of sales you're even looking at. The district's own competitiveness score sits at just 28 out of 100, not because demand is weak, but because so few of these homes ever come up for sale that there's rarely enough competing inventory to fight over.
A one-month average built on thirteen closings isn't a market signal. It's whichever two or three houses happened to sell that month.
Compare that to Nexton, where the median sold price over the trailing twelve months came in at $469,995, up 4 percent, a number stable enough to actually mean something because it's built on a much deeper pool of closings. Homes there took an average of 76 days to sell, well above the roughly 58-day national norm, but that slower pace reflects steady new supply, not thin inventory.
The Three Numbers Side by Side
| Submarket | Price per square foot | Typical time on market | What actually sets it apart |
|---|---|---|---|
| Historic District | About $259, based on the three months ending May 2026 | 57 to 76 days, on roughly 13 sales a month | Pre-WWI architecture, Azalea Park, walking distance to Hutchinson Square |
| Nexton | Around $200 or more | About 76 days | Nexton Square retail hub, gigabit internet, hundreds of annual closings |
| Cane Bay Plantation | Under $195 in most sections | Roughly 70 to 90 days | HOA fees as low as $650 a year in standard sections, YMCA and grocery anchors, extensive trail network |
The price-per-square-foot gap between the Historic District and the newer communities isn't just about age or finishes. It's about what you're actually buying. A dollar spent in the Historic District buys proximity to Azalea Park and a walkable downtown that took over a century to build. A dollar spent in Cane Bay buys square footage, a lower HOA bill, and a faster-moving pool of comparable homes to negotiate against.
What This Means If You're Comparing Neighborhoods
If you're a move-up buyer weighing Summerville against Mount Pleasant or another Lowcountry suburb, the town-wide median is close to useless for your purposes. You need the submarket number, not the blended one. A buyer set on walkability and pre-war character should be pricing against the Historic District's $259-per-square-foot figure and its thin, slow-moving inventory, not against the $410,000 town median that a new-construction subdivision is quietly pulling downward.
A buyer prioritizing new systems, a lower HOA bill, and a faster close should be looking at Cane Bay's sub-$195 pricing or Nexton's $200-plus range, where sales volume is high enough that the numbers actually describe typical behavior rather than a handful of outliers. Neither approach is more correct than the other. They're just answering different questions, and the town-wide median answers neither one well.
Which Number Should You Actually Use
If your search is centered on the Historic District, treat any single-month price you see with real skepticism and ask for a rolling multi-quarter comparison instead. A market with 13 closings a month needs a longer window before a trend means anything. If your search is centered on Nexton or Cane Bay, the monthly and trailing-twelve-month figures are more trustworthy simply because there's more volume behind them, but remember that new phases still coming online can shift pricing and inventory as builders release more product.
A Few Questions Worth Asking Directly
Why does the Historic District show such different numbers depending on the source? Low sales volume. With roughly a dozen homes changing hands there in a typical month, the choice between a one-month average and a three-month median can produce numbers that look contradictory even though both are technically accurate for their stated window.
Does a lower price per square foot in Cane Bay or Nexton mean better value? It depends what you're weighing it against. Lower price per square foot in the newer communities generally reflects new construction efficiency and lower HOA costs, not a discount on comparable homes. It's a different product, not a better price on the same one.
Is the Historic District's price swing a sign the market is cooling or heating up? Neither, on its own. A 29.8 percent one-month increase and a 52.9 percent three-month decrease in the same data set both come from the same small pool of sales. Treat any single-window number from a low-volume submarket as a data point, not a trend.
If you're trying to figure out which of these Summervilles actually fits your search, that's a conversation worth having with someone who tracks both sides of this town closely. Rose Gold Properties works across the Historic District, Nexton, and Cane Bay Plantation, and can walk you through what your budget actually buys in each. Request your home estimate today and we'll help you figure out which number in this town is the one that matters for your move.